While some individual stocks (cough TWTR cough) may have reached irrational bubble territory, the US equity market is undergoing a seemingly 'rational' bubble. However, as John Hussman illustrates in the following chart, the probability of a stock market crash is growing extremely rapidly.

Based on the this paper, Hussman simplifies the rational bubble as:
You only hold one long one more period if expected return is positive - requiring EXTRAGAIN x (1-p) + CRASHLOSS x (p) to be greater than 0.
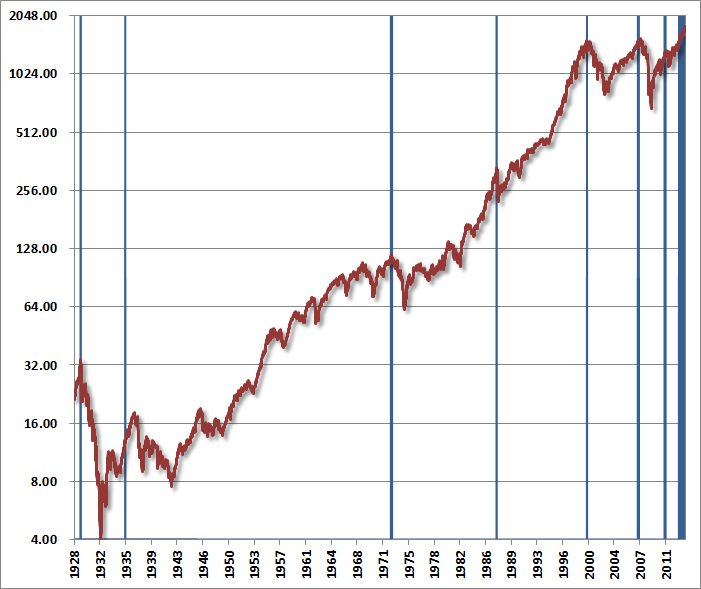
Regardless of last week’s slight tapering of the Federal Reserve’s policy of quantitative easing, speculators appear intent on completing the same bubble pattern that has attended a score of previous financial bubbles in equity markets, commodities, and other assets throughout history and across the globe.
The chart below provides some indication of our broader concerns here.The blue lines indicate the points of similarly overvalued, overbought, overbullish, rising-yield conditions across history (specific definitions and variants of this syndrome can be found in numerous prior weekly comments). Sentiment figures prior to the 1960’s are imputed based on the relationship between sentiment and the extent and volatility of prior market fluctuations, which largely drive that data.
Most of the prior instances of this syndrome were not as extreme as at present (for example, valuations are now about 35% above the overvaluation threshold for other instances, overbought conditions are more extended here, and with 58% bulls and only 14% bears, current sentiment is also far more extreme than necessary). So we can certainly tighten up the criteria to exclude some of these instances, but it’s fair to say that present conditions are among the most extreme on record.
This chart also provides some indication of our more recent frustration, as even this variant of “overvalued, overbought, overbullish, rising-yield” conditions emerged as early as February of this year and has appeared several times in the past year without event. My view remains that this does not likely reflect a permanent change in market dynamics – only a temporary deferral of what we can expect to be quite negative consequences for the market over the completion of this cycle.
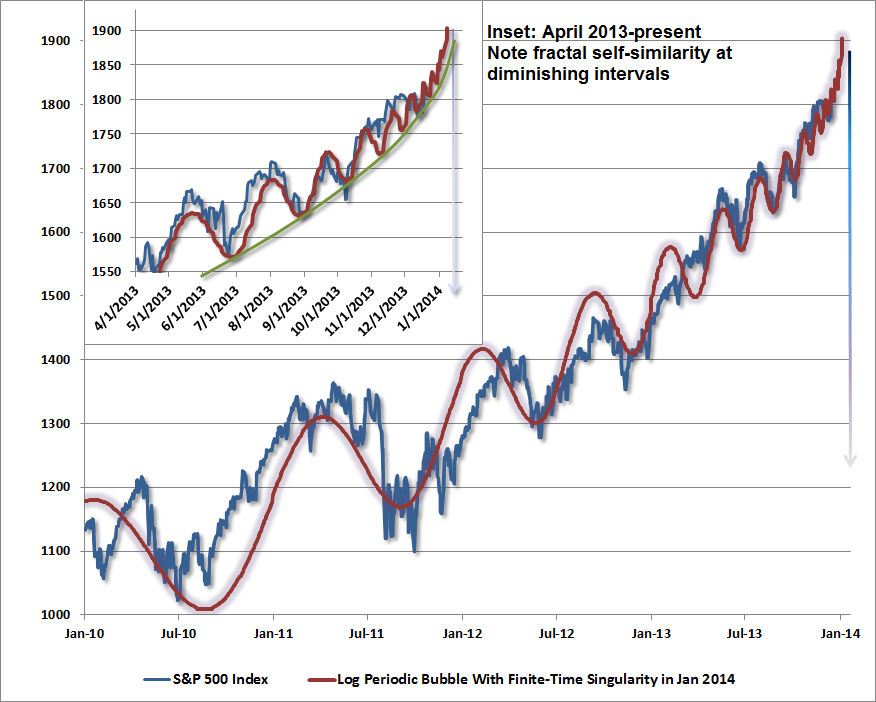
Narrowing our focus to the present advance, what concerns us isn’t simply the parabolic advance featuring increasingly immediate impulses to buy every dip – which is how we characterize the psychology behind log-periodic bubbles (described by Didier Sornette in Why Markets Crash). It’s that this parabola is attended by so many additional and historically regular hallmarks of late-phase speculative advances. Aside from strenuously overvalued, overbought, overbullish, rising-yield conditions, speculators are using record amounts of borrowed money to speculate in equities, with NYSE margin debt now close to 2.5% of GDP.
This is a level seen only twice in history, briefly at the 2000 and 2007 market peaks. Margin debt is now at an amount equal to 26% of all commercial and industrial loans in the U.S. banking system. Meanwhile, we are again hearing chatter that the Federal Reserve has placed a “put option” or a “floor” under the stock market. As I observed at the 2007 peak, before the market plunged 55%, “Speculators hoping for a ‘Bernanke put’ to save their assets are likely to discover – too late – that the strike price is way out of the money.”
The following chart is not a forecast, and certainly not something to be relied upon. It does, however, provide an indication of how Sornette-type bubbles have ended in numerous speculative episodes in history, in equities, commodities, and other assets, both in the U.S. and abroad. We are already well within the window of a “finite-time singularity” – the endpoint of such a bubble, but it is a feature of parabolas that small changes in the endpoint can significantly change the final value. The full litany of present conditions could almost be drawn from a textbook of pre-crash speculative advances. We observe the lowest bearish sentiment in over a quarter century, speculation in equities using record levels of margin debt, depressed mutual fund cash levels, heavy initial public offerings of stock, record issuance of low-grade “covenant lite” debt, strikingly rich valuations on a wide range of measures that closely correlate with subsequent market returns, faith that the Fed has put a “floor” under the market (oddly the same faith that investors relied on in 2007), and the proliferation of “this time is different” adjustments to historically reliable investment measures.
Even at 1818 on the S&P 500, we have to allow for the possibility that speculators have not entirely had their fill. In my view, the proper response is to maintain a historically-informed discipline, but with limited concessions (very small call option positions have a useful contingent profile) to at least reduce the temptation to capitulate out of undisciplined, price-driven frustration. Regardless of whether the market maintains its fidelity to a “log-periodic bubble,” we’ll continue to align our position with the expected return/risk profile as it shifts over time. That said, the “increasingly immediate impulses to buy every dip” that characterize market bubbles have now become so urgent that we have to allow for these waves to compress to a near-vertical finale.
The present log-periodic bubble suggests that this speculative frenzy may very well have less than 5% to run between current levels and the third market collapse in just over a decade.
As I advised in 2008 just before the market collapsed, be very alert to increasing volatility at 10-minute intervals.
Credit to Zero Hedge
Today’s most accurate tips for stock
ReplyDeleteBUY ARVIND FUTURES ABOVE 137 TG-137.4/138/139 SL-136.2(CMP136.8)
mcx tips free trial on mobile