Wednesday, August 16, 2017
"Sleepwalking Into An Even Worse Version Of The 1930's Depression"
World GDP in current US dollars is in some sense the simplest world GDP calculation that a person might make. It is calculated by taking the GDP for each year for each country in the local currency (for example, yen) and converting these GDP amounts to US dollars using the then-current relativity between the local currency and the US dollar.
To get a world total, all a person needs to do is add together the GDP amounts for all of the individual countries. There is no inflation adjustment, so comparing GDP growth amounts calculated on this basis gives an indication regarding how the world economy is growing, inclusive of inflation. Calculation of GDP on this basis is also inclusive of changes in relativities to the US dollar.
What has been concerning for the last couple of years is that World GDP on this basis is no longer growing robustly. In fact, it may even have started shrinking, with 2014 being the peak year. Figure 1 shows world GDP on a current US dollar basis, in a chart produced by the World Bank.
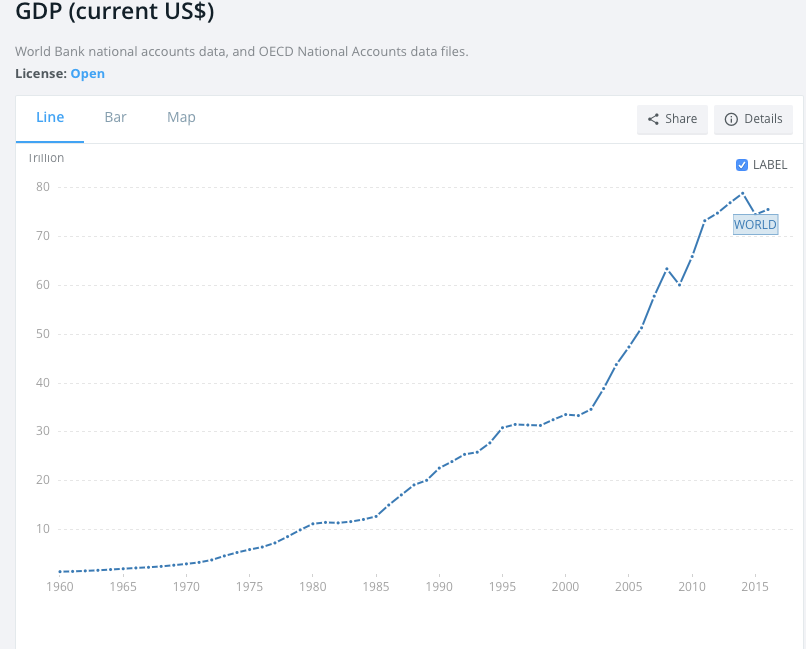
Figure 1. World GDP in “Current US Dollars,” in chart from World Bank website.
Since the concept of GDP in current US dollars is not a topic that most of us are very familiar with, this post, in part, is an exploration of how GDP and inflation calculations on this basis fit in with other concepts we are more familiar with.
As I look at the data, it becomes clear that the reason for the downturn in Current US$ GDP is very much related to topics that I have been writing about. In particular, it is related to the fall in oil prices since mid-2014 and to the problems that oil producers have been having since that time, earning too little profit on the oil they sell. A similar problem is affecting natural gas and coal, as well as some other commodities. These low prices, and the deflation that they are causing, seem to be flowing through to cause low world GDP in current US dollars.
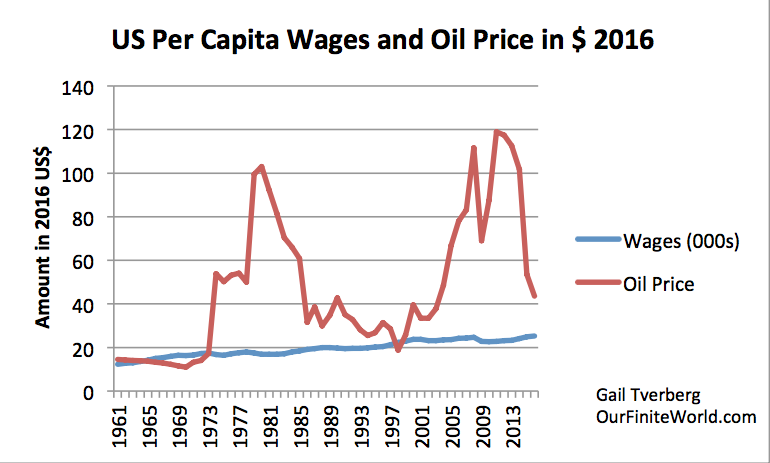
Figure 2. Average per capita wages computed by dividing total “Wages and Salaries” as reported by US BEA by total US population, and adjusting to 2016 price level using CPI-Urban. Average inflation adjusted oil price is based primarily on Brent oil historical oil price as reported by BP, also adjusted by CPI-urban to 2016 price level.
While energy products seem to be relatively small compared to world GDP, in fact, they play an outsized role. This is the case partly because the use of energy products makes GDP growth possible (energy provides heat and movement needed for industrial processes), and partly because an increase in the price of energy products indirectly causes an increase in the price of other goods and services. This growth in prices makes it possible to use debt to finance goods and services of all types.
A decrease in the price of energy products has both positive and negative impacts. The major favorable effect is that the lower prices allow the GDPs of oil importers, such as the United States, European Union, Japan, and China, to grow more rapidly. This is the effect that has predominated so far.
The negative impacts appear more slowly, so we have seen less of them so far. One such negative impact is the fact that these lower prices tend to produce deflation rather than inflation, making debt harder to repay. Another negative impact is that lower prices (slowly) push companies producing energy products toward bankruptcy, disrupting debt in a different way. A third negative impact is layoffs in affected industries. A fourth negative impact is lower tax revenue, particularly for oil exporting countries. This lower revenue tends to lead to cutbacks in governmental programs and to disruptions similar to those seen in Venezuela.
In this post, I try to connect what I am seeing in the new data (GDP in current US$) with issues I have been writing about in previous posts. It seems to me that there is no way that oil and other energy prices can be brought to an adequate price level because we are reaching an affordability limit with respect to energy products. Thus, world GDP in current dollars can be expected to stay low, and eventually decline to a lower level. Thus, we seem to be encountering peak GDP in current dollars.
Furthermore, in the years ahead the negative impacts of lower oil and other energy prices can be expected to start predominating over the positive impacts. This change can be expected to lead to debt-related financial problems, instability of governments of oil exporters, and falling energy consumption of all kinds.
Peak Per Capita Energy Consumption Is Part of the Problem, Too
One problem that makes our current situation much worse than it might otherwise be is the fact that world per capita energy consumption seems to have hit a maximum in 2013 (Figure 3).
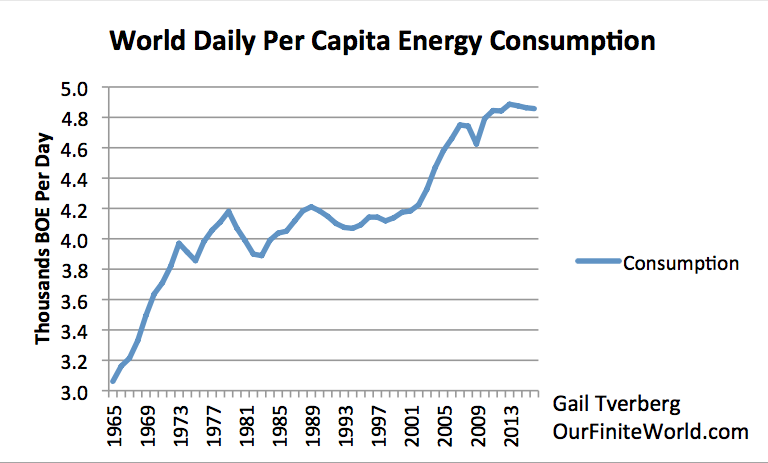
Figure 3. World Daily Per Capita Energy Consumption, based on primary energy consumption from BP Statistical Review of World Energy and 2017 United Nations population estimates.
Surprisingly, this peak in consumption occurred before oil and other energy prices collapsed, starting in mid-2014. At these lower prices, a person would think that consumers could afford to buy more energy goods per person, not fewer.
Per capita energy consumption should be rising with lower prices, unless the reason for the fall in prices is an affordability problem. If the drop in prices reflects an affordability problem (wages of most workers are not high enough to buy the goods and services made with energy products, such as homes and cars), then we would expect the pattern we are seeing today–low oil and other energy prices, together with falling per capita consumption. If the reason for falling per capita energy consumption is an affordability problem, then there is little hope that prices will rise sufficiently to fix our current problem.
One consideration supporting the hypothesis that we are really facing an affordability problem is the fact that in recent years, energy prices have been too low for companies producing oil and other energy products. Since 2015, hundreds of oil, natural gas, and coal companies have gone bankrupt. Saudi Arabia has had to borrow large amounts of money to fund its budget, because at current prices, tax revenues are too low to fund it. In the United States, investors are cutting back on their support for oil investment, because of the continued financial losses of the companies and evidence that approaches for mitigating these losses are not really working.
Which Countries Are Suffering Falling GDP in Current US Dollars?
With lower oil prices, Saudi Arabia is one of the countries with falling GDP in Current US$.
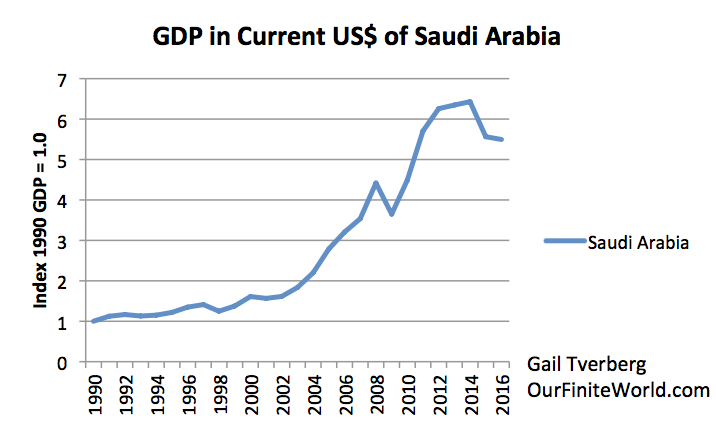
Figure 4. Increase in GDP since 1990 for Saudi Arabia in current US dollars, based on World Bank Data.
Saudi Arabia pegs its currency to the dollar, so its lower GDP is not because its currency has fallen relative to the US dollar; instead, it reflects a situation in which fewer goods and services of all kinds are being produced, as measured in US dollars. GDP calculations do not consider debt, so Figure 4 indicates that even with all of Saudi Arabia’s borrowing to offset falling oil revenue, the quantity of goods and services it was able to produce fell in both 2015 and 2016.
Other oil-producing countries are clearly having problems as well, but data is often missing from the World Bank database for these countries. For example, Venezuela is clearly having problems with low oil prices, but GDP amounts for the country are missing for 2014, 2015, and 2016. (Somehow, world totals seem to include estimates of the total omitted amounts, however.)
Figure 5 shows similar ratios to Figure 4 for a number of other commodity producing countries.
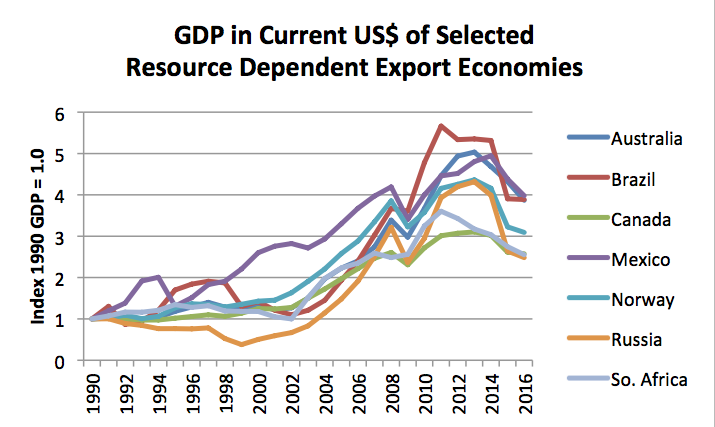
Figure 5. GDP patterns, in US current dollars, for selected resource exporting countries, based on World Bank data.
A comparison of Figures 4 and 5 shows that the GDP patterns for these countries are similar to that of Saudi Arabia. Because resources (including oil) do not account for as large a share of GDP for these countries as for Saudi Arabia, the peak as a percentage of 1990 GDP isn’t quite as high as for Saudi Arabia. But the trend is still downward, with 2014 typically the peak year.
We can also look at similar information for the historically big consumers of oil, coal and natural gas, namely the United States, the European Union, and Japan.
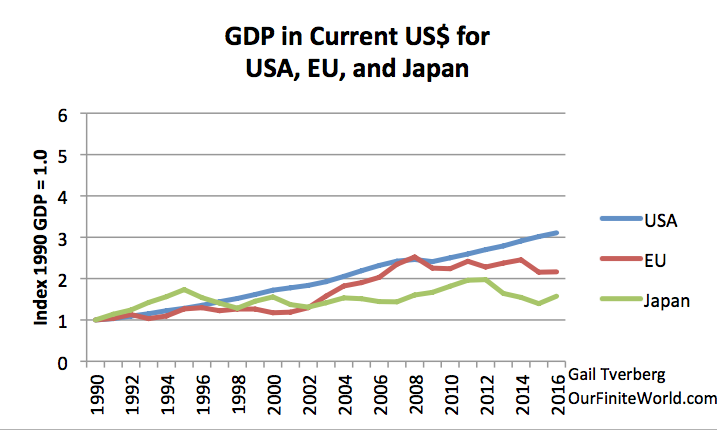
Figure 6. Increase in GDP since 1990 for the United States, the European Union, and Japan, in current US dollars, based on World Bank data.
Here, we find the growth trend is much more subdued than for the countries shown in the previous two charts. I have purposely put the upper limit of the scale of this chart at 6 times the 1990 GDP level. This limit is similar to the upper limit on earlier charts, to emphasize how much more slowly these countries have been growing, compared to the countries shown in Figures 4 and 5.
In fact, for the European Union and Japan, GDP in current US$ is now lower than it has been in recent years. Figure 6 is telling us that the goods and services produced in these countries are now lower in US dollar value than they were a few years ago. Since part of the cost of goods and services is used to pay wages, this lower relativity indirectly implies that the wages of workers in the EU and Japan are falling, relative to the cost of buying goods and services priced in US dollars. Thus, even apart from taxes added by these countries, consumers in the EU and Japan have been falling behind in their ability to buy energy products priced in US dollars.
Figure 6 indicates that the United States has been doing relatively better than the European Union and Japan, in terms of the value of goods and services produced each year continuing to grow. If we look back at Figure 2, however, we see that even in the US, wage growth has lagged far behind oil price increases. Thus, the US was also likely headed toward an affordability problem relating to goods and services made with oil.
The Asian exporting nations have been doing relatively better in keeping their economies growing, despite the downward pressure on energy prices.
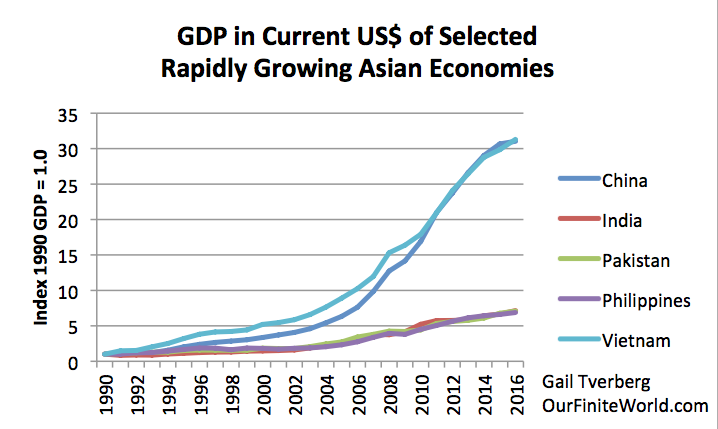
Figure 7. Increase in GDP since 1990 for selected rapidly growing Asian exporting countries in current US dollars, based on World Bank data.
The two most rapidly growing countries are China and Vietnam. There seems to be a recent slowing of their growth rates, but no actual downturn.
India, Pakistan, and the Philippines are growing less rapidly. They do not seem to be experiencing any downturn at all.
Considering the indications of Figure 4 through 7, it appears that only a relatively small share of countries have experienced rising GDP in current US dollars. Although we have not looked at all possible groupings, the countries that seem to be doing best in terms of rising current US$ GDP are countries that are exporters of manufactured goods, including the Asian countries shown. Countries that derive significant GDP from producing energy products and other commodities seem to be experiencing falling GDP in current US dollars.
To fix the problems shown here, we would need to get prices of oil and other energy products back up again. This would indirectly raise prices of many other products as well, including food, new vehicles, and new homes. With lagging wages in many countries, this would seem to be virtually impossible to accomplish.
The Wide Range of GDP Indications We See
In this post, I am talking about GDP of various countries, converted to a US$ basis. This is not quite the same as the GDP that we normally read about. It is not until a person starts working with world data that a person appreciates how different the various GDP and inflation calculations are.
GDP in US dollars is very important because energy products, including oil, are generally priced in US$. This seems to be true, whether or not the currency used in the actual transaction is US$. See Appendix A for charts showing the close connection between these two items.
The type of GDP is generally reported is inflation-adjusted (also called “real”) GDP. The assumption is made that no one will care (very much) about inflation rates. In general, inflation-adjusted GDP figures are much more stable than those in Current US$. This can be seen by comparing world GDP in Figure 8 with that shown in Figure 1.
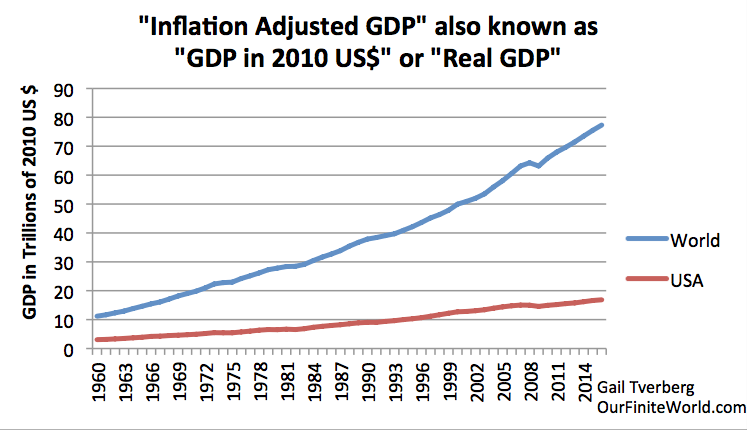
Figure 8. GDP in 2010 US dollars, for the world and for the United States, based on World Bank data.
Using inflation-adjusted world GDP data, there doesn’t seem to be any kind of crisis ahead. The last major problem was in the 2008-2009 period. Even the impact of this crisis appears to be fairly small. The 2008-2009 crisis shows up more distinctly in the Current US$ amounts plotted in Figure 1.
World GDP growth figures that are published by the World Bank and others combine country by country data using some type of weighting approach. Economists tend to use an approach called Purchasing Power Parity (PPP). This approach gives a great deal more weight to developing nations than the US dollar weighted approach used elsewhere in this post. For example, under the PPP approach, China seems to get a weighting of about 1.9 times its GDP in US$; India seems to get a weighting of about 3.8 times its GDP in US$. The United States gets a weight of 1.0 times its GDP in US$, and the weights for developed nations tend to be fairly close to 1.0 times their GDP in US$. The world GDP we see published regularly should be called “inflation-adjusted world GDP, calculated with PPP weights.”
The relationship among the three types of GDP can be seen in Figure 9. It is clear that GDP growth in Current US$ is far more variable than the inflation-adjusted growth rate (in 2010 US$). PPP inflation-adjusted GDP growth is consistently higher than GDP growth with US dollar weighting.
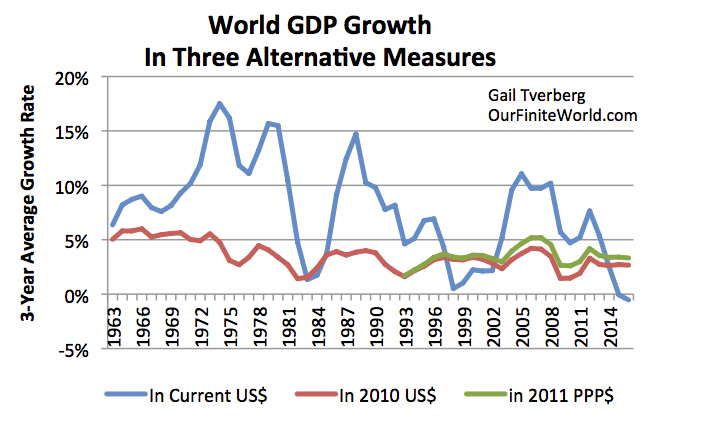
Figure 9. World GDP Growth in three alternative measures: Current dollars, Inflation-adjusted GDP is in 2010 US$ and adjusted to purchasing power parity (PPP).
It is also clear from Figure 9 that there is also a big “Whoops” in the most recent years. Economic growth is at a record low level, as calculated in Current US$.
World “Inflation” Indications
The typical way of calculating inflation is by looking at prices of a basket of goods in a particular currency, such as the yen, and seeing how the prices change over a period of time. To get an inflation rate for a group of countries (such as the G-20), inflation rates of various countries are weighted together using some set of weights. My guess is that these weights might be the PPP weights used in calculating world GDP.
In Figure 10, I calculate implied world inflation using a different approach. Since the World Bank publishes World GDP both in 2010 US$ and in Current US$, I calculate the implied world inflation rate by comparing these two sets of values. (Some people might call what I am calculating the implicit price deflator for GDP, rather than an inflation rate.) I use three-year averages to smooth out year-to-year variability in these amounts.
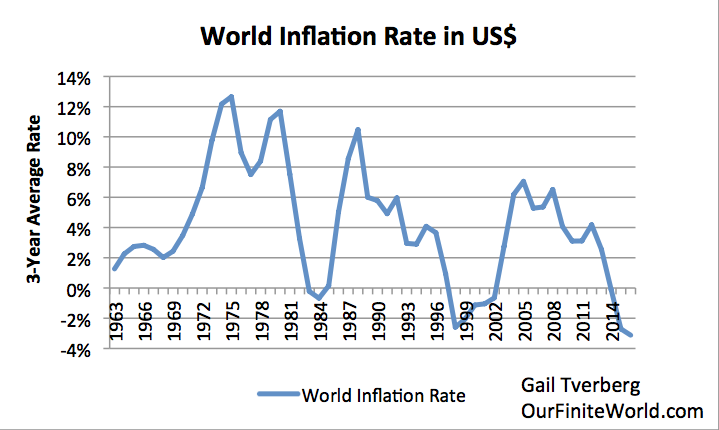
Figure 10. World inflation rate calculated by comparing reported World GDP in Current US$ to reported World GDP in 2010 US$. Both of these amounts are available at the World Bank website.
The implied world inflation rates using this approach are fairly different from published inflation rates. In part, this is because the calculations take into account changing relativities of currencies. There may be other factors as well, such as the inclusion of countries that would not normally be included in aggregations. Inflation rates tend to be high when demand for energy products is high, and low when demand for energy products is low.
Figure 10 shows that, on a world basis, there have been negative inflation rates three times since 1963–in approximately 1983-1984; in the late 1990s to early 2000s; and since about 2014. If we compare these dates to the oil price and energy consumption data on Figures 2 and 3, we see that these time periods are ones that are marked by falling per capita energy consumption and by low oil prices. In some sense, these are the time periods when the economy is/was trying to stall, for lack of adequate demand for oil.
The workaround used to “fix” the lack of demand in the late 1990s to early 2000s seems to have been an increased focus on globalization. China’s growth in particular was very important, because it added both a rapidly growing supply of cheap energy from coal and a great deal of demand for energy products. The addition of coal effectively lowered the average price of energy products so that they were again affordable by a large share of the world population. The availability of debt to pull the Chinese and other Asian economies forward was no doubt of importance as well.
The United States has been fairly protected from much of what has happened because its currency, the US Dollar, is the world’s reserve currency. If we look at the inflation rate of the United States using data of the US Bureau of Economic Analysis, the last time the United States had a substantial period of contracting prices was in the US Depression of the 1930s. It is quite possible that such a situation existed worldwide, but I do not have world data for that period.
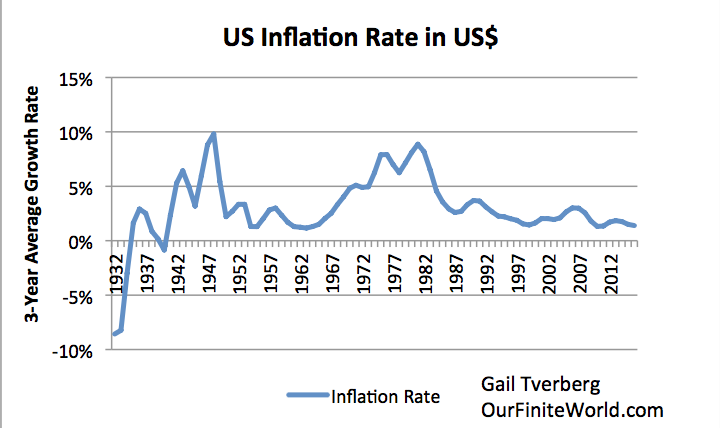
Figure 11. US inflation rate (really “GDP Deflator”) obtained by comparing US GDP in 2009 US$ to GDP in Current US $, based on US Bureau of Economic Analysis data.
It was during the Depression of the 1930s that debt defaults became widespread. It was only through deficit spending, including the significant debt-based funding for World War II, that the problem of inadequate demand for goods and services was completely eliminated.
How Do We Solve Our World Deflation Crisis This Time
There seem to be three ways of creating demand for goods and services.
[1] A growing supply of cheap-to-produce energy products is really the basic way of increasing demand through economic growth.
If there are cheap-to-produce energy products available, a growing supply of these energy products can be used to increasingly leverage human labor, through the use of more and better “tools” for the workers. When workers become increasingly more productive, their wages naturally rise. It is this growing productivity of human labor that generally produces the rising demand needed to maintain the economic growth cycle.
As growth in energy consumption slows and then declines (Figure 3), this productivity growth tends to disappear. This seems to be part of today’s problem.
[2] Increasing the amount of debt outstanding can work to make the energy extraction system work more effectively, by raising the price that consumers can afford to pay for high-priced goods.
This increasing ability to pay for high-priced goods seems to come in two ways:
(a) The debt itself can be used to pay for goods, making these goods more affordable on a month-to-month or year-to-year basis.
(b) Increased debt can lead to increased wages for wage earners, because some of the increased debt ultimately goes to create new jobs and to pay workers. Figure 12 shows the positive association that increasing debt seems to have with inflation-adjusted wages in the United States.
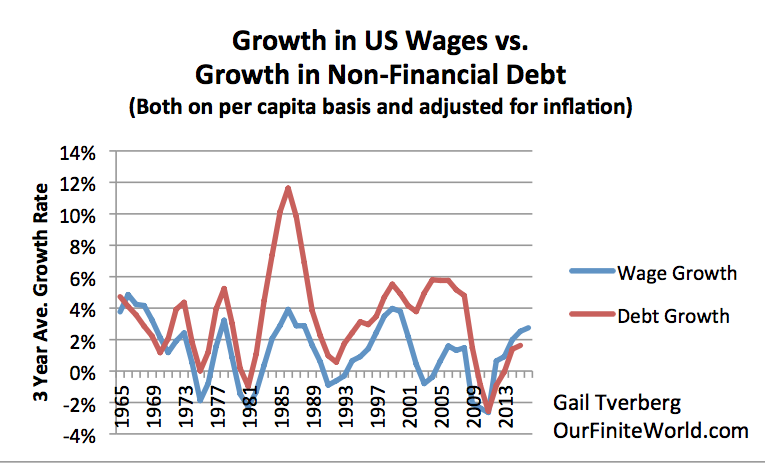
Figure 12. Growth in US Wages vs. Growth in Non-Financial Debt. Wages from US Bureau of Economics “Wages and Salaries.” Non-Financial Debt is discontinued series from St. Louis Federal Reserve. (Note chart does not show a value for 2016.) Both sets of numbers have been adjusted for growth in US population and for growth in CPI Urban.
Debt is, in effect, the promise of future goods and services made with energy products. These promises are often helpful in allowing an economy to expand. For example, businesses can issue bonds to provide funds to expand their operations. Selling shares of stock acts in a manner similar to adding debt, with repayment coming from future operations. In both cases, the payback can occur, if energy consumption is in fact growing, allowing the output of the business to expand as planned.
Once world leaders decide that debt levels are too high, or need to be controlled better, we are likely headed for trouble, because debt can be very helpful in “pulling the economy forward.” This is especially the case if productivity growth is low because per capita energy consumption is falling.
[3] Rebalancing of currency relativities to the US dollar.
Rebalancing currencies to different levels relative to the dollar seems to play a major role in determining the “inflation rate” calculated in Figure 10. Currency rebalancing also plays a major role in determining the shape of the GDP graph in current US$, as shown in Figure 1. In general, the higher the average relativity of other currencies to the US$, the higher the demand for goods and services of all kinds, and thus the higher the demand for energy products.
One problem in recent years is that, in some sense, the average relativity of other currencies to the US dollar has fallen too low. The fall in relativities took place when the US discontinued its use of Quantitative Easing in late 2014.
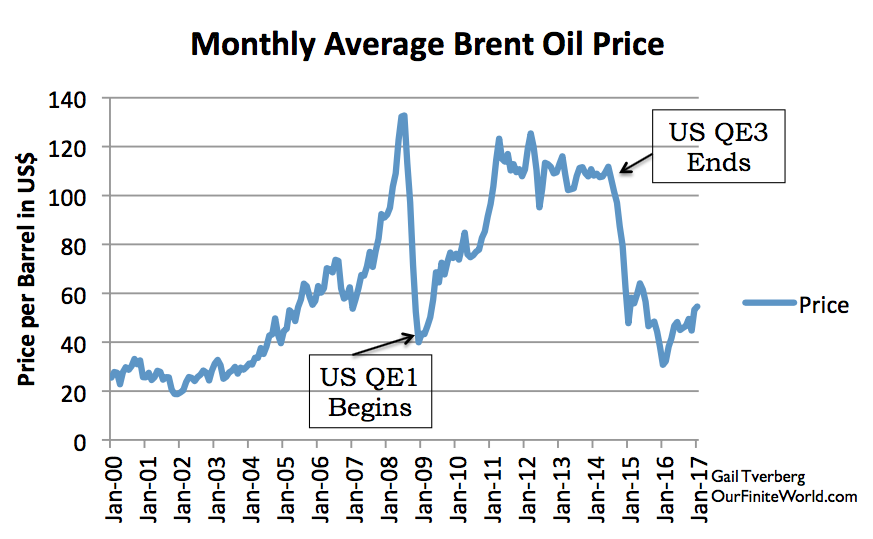
Figure 13. Monthly Brent oil prices with dates of US beginning and ending QE.
The price of oil and of other energy products dropped steeply at that time. In fact, in inflation-adjusted terms, oil prices had been falling even prior to the end of QE. (See Figure 2, above.) The shift in the currency relativities made oil and other energy products more expensive for citizens of the European Union, Japan, and most of the commodity producing countries shown in Figures 4 and 5.
The ultimate problem underlying this fall in average relativities to the US dollar is that there is now a disparity between the prices that consumers around the world can afford to pay for energy products, and the prices that businesses producing energy products really need. I have written about this problem in the past, for example in Why Energy-Economy Models Produce Overly Optimistic Indications.
At this point, none of the three approaches for solving the world’s deflation problem seem to be working:
[1] Increasing the supply of oil and other energy products is not working well, because diminishing returns has led to a situation where if prices are high enough for producers, they are too high for consumers to afford the finished goods made with the energy products.[2] World leaders have decided that we have too much debt and, indeed, debt levels are very high. In fact, if energy prices continue to be low, a significant amount of debt currently outstanding will probably be defaulted on.[3] Countries generally don’t want to raise the exchange rates of their currencies to the dollar, because lower exchange rates tend to encourage exports. If the United States raises its interest rates, either directly or by selling its QE bonds, the level of the US dollar can be expected to rise relative to other currencies. Thus, other currencies are likely to fall even lower than they are today, relative to the US dollar. This will tend to make the problem with low oil prices (and other energy prices) even worse than today.
Thus, there seems to be no way out of our current predicament.
Conclusion
The world economy is in a very precarious situation. Many of the world’s economies have found that, measured in current US$, the goods and services they are producing are less valuable than they were in 2013 and 2014. In particular, all of the oil exporting nations have this problem. Many other countries that are producing commodities have the same problem.
Governments around the world do not seem to understand the situation we are facing. In large part, this is happening because economists have built models based on their view of how the world works. Their models tend to leave out the important role energy plays. GDP growth and inflation estimates based on PPP calculations give a misleading view of how the economy is actually operating.
We seem to be sleepwalking into an even worse version of the Depression of the 1930s. Even if economists were able to figure out what is happening, it is not clear that there would be a good way out. Higher energy prices would aid energy producers, but would push energy importing nations into recession. We seem to be facing a predicament with no solution.
Credit to Zero Hedge
Subscribe to:
Posts (Atom)