Friday, May 6, 2016
Caught On Tape: 100s Of M1 Abrams Tanks Roll Through Houston, TX
Just days after we exposed Texas police planning for riots and conducting mass arrest drills, the site of hundreds of M1 Abrams battle-tanks rolling on a train through Houston raised more than a few eyebrows...
Several locals reported seeing a train Tuesday, loaded full of tanks, painted in a desert tan color - the second time in a week.
Credit to Zero Hedge
The Historic Dow Jones-Silver Ratio Points To $300 Silver
That’s correct. Going by the historic Dow Jones-Silver ratio, it points to $300 silver. This may seem outlandish or a play on hype, but it isn’t. While many precious metals analysts have forecasted high three-digit silver prices, I didn’t pay much attention to them. However, after I looked over all the data, $300 silver is not a crazy figure at all.
Let me explain. The U.S. economy suffered a fatal blow in the 1970’s as its domestic oil production peaked and inflation soared. To protect against the ravages of inflation, investors moved into gold and silver in a big way. Yes, it’s true that the Hunt’s bought a lot of silver during the 1970’s, but who was buying gold to push its price to $850 in 1980 versus $35 in 1970. Furthermore, who was buying oil to push its price up to $36 in 1980 from $1.80 in 1970??
As U.S. oil production and the EROI- Energy Returned On Invested continued to decline in the following decades, the American economy transitioned away from a high-paying manufacturing economy to what I call a LEECH & SPEND SERVICE ECONOMY. Thus, each new decade brought about a new bubble to keep the facade of a growing economy alive.
We had the Department of Defense Military spending Bubble in the 1980’s, the Tech Bubble of the 1990’s, the Housing Bubble of the 2000’s and now we have the Auto, Housing, College, HealthCare, Stock Market, Retirement and U.S. Treasury Bubble. The present highly-leveraged bubble will end all bubbles.
Short Term Silver Market Analysts Can’t See The Forest For The Trees
I wrote about this in my recent article, Precious Metals Investor: Must See Important Charts & Data,
Unfortunately, Mr. Weiner’s gold-silver basis charting analysis wont put food on the table when the complex supply chain system disintegrates due to the collapse of U.S. energy production. However, owning physical gold and silver at this time could help considerably.
Mr Keith Weiner and Dan Norcini both view the precious metals with blinders on. I would imagine both of these trading analysts have no idea of the future negative impacts of the energy market or the ramifications of the Falling EROI – Energy Returned On Invested. Thus, they continue to make short-term forecasts as if the world will continue to grow for the next century.
Unfortunately, most Americans have their wealth tied into financial products that have no future. Furthermore, the Auto & Real Estate Market will crash to a level that will take the breath away from even the most bearish analysts. Thus, there will be very few worthy physical assets to own at this time. The two physical assets I value the most are gold and silver.
The Historic Dow Jones-Silver Ratio Points To $300 Silver
If we look at the the Dow Jones-Silver chart, we can see we are no where close to the 25/1 ratio of 1980:
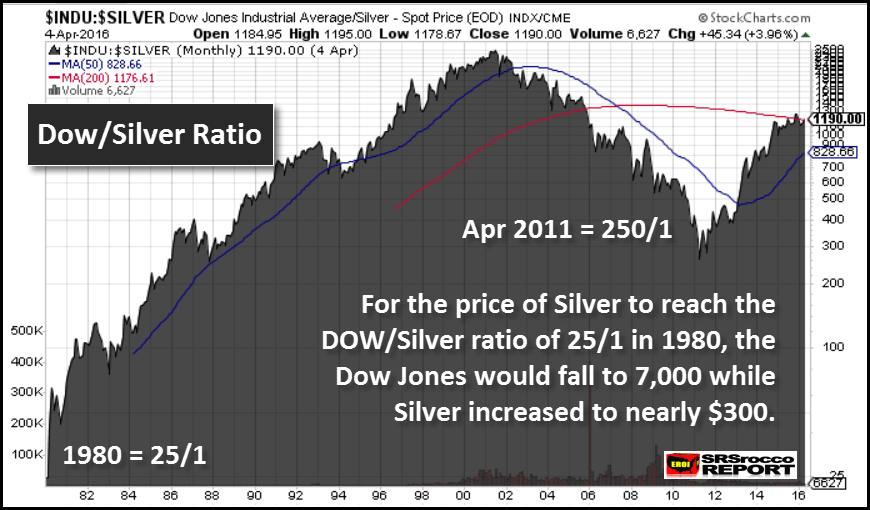
You really can’t see the 25/1 Dow Jones-Silver ratio in 1980 as it is a small blip on the bottom left-hand portion of the chart. In Feb 1980, the Dow Jones traded at 865 points while silver traded at $35. Can you imagine that??? The Dow Jones Industrials trading at 865 points?
Then when silver reached a high of $49 in April 2011, the Dow Jones-Silver ratio fell to 250/1 from a high of 2,500/1 in June 2001. Note: I am using round numbers here showing the Dow Jones-Silver ratio. So, from 1980 to 2001, the Dow Jones-Silver ratio increased 100 times from 25/1 to 2,500/1. Then it fell 10 times to 250/1 in 2011. Currently, the Dow Jones-Silver ratio is 1,015/1.
We all know the broader markets are being propped up by the Fed and U.S. Government Plunge Protection Team. However, at some point the markets will finally resume their crash lower. If we assume that Dow Jones falls to 7,000 points, a 25/1 Dow Jones-Silver ratio would suggest a $300 silver price (rounded figure).
Unfortunately, I don’t believe the Dow Jones Index will stop at 7,000. It will likely fall much lower.
Now, why would the value of silver rise as the Dow Jones falls in value? This has to do with the massive amount of debt in the system. Here is a chart of total U.S. debt from my article linked above:
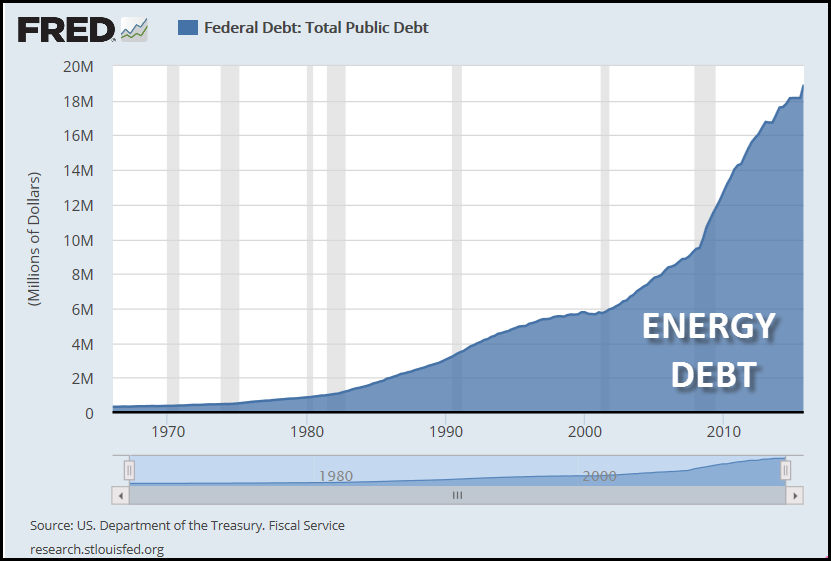
You will notice the debt remained flat in the early 1970’s, but started to move up in the latter part of the decade. In the first quarter of 1980, total U.S. debt stood at $863 billion when the price of silver traded at $35. Today, the current U.S. debt is $19.2 trillion while the price of silver is less than half at $17.30. The total amount of U.S. Debt has increased 22 times while the value of silver is less than half.
Now, I labeled the chart as ENERGY DEBT because it takes the burning of energy to create “PROFITABLE” economic activity to pay back the debt. Investors need to understand it takes “Profitable” economic activity to pay back debt. We really haven’t had profitable economic activity for at least the past decade as U.S. debt would have been declining. We must remember, profitable economic activity allows debt to be repaid.
So, the Fed and U.S. Government have continued the official policy of printing money and increasing debt to continue business as usual. This has given the ILLUSION of growth and an increase in the Dow Jones Index. However, if we take a look at the Dow Jones Index below, we can see something is seriously wrong:
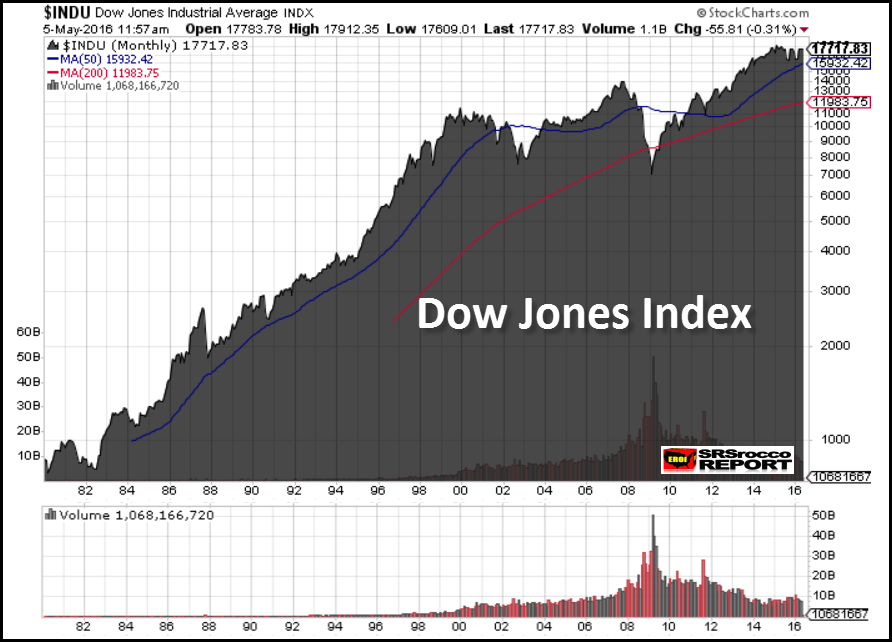
The Dow Jones Index has been rising since the crash in 2009 on lower trading volume. Furthermore, the reason the Dow Jones Index has increased from 865 points in Q1 1980 to 17,663 recently was due to the massive increase of U.S. Debt from $863 billion to $19.2 trillion during the same time period. The Dow Jones Index increased 21 times while total U.S. Debt increased 22 times.
THIS IS NO COINCIDENCE!!!
Now, let’s take a look at the silver price chart over the same time period:
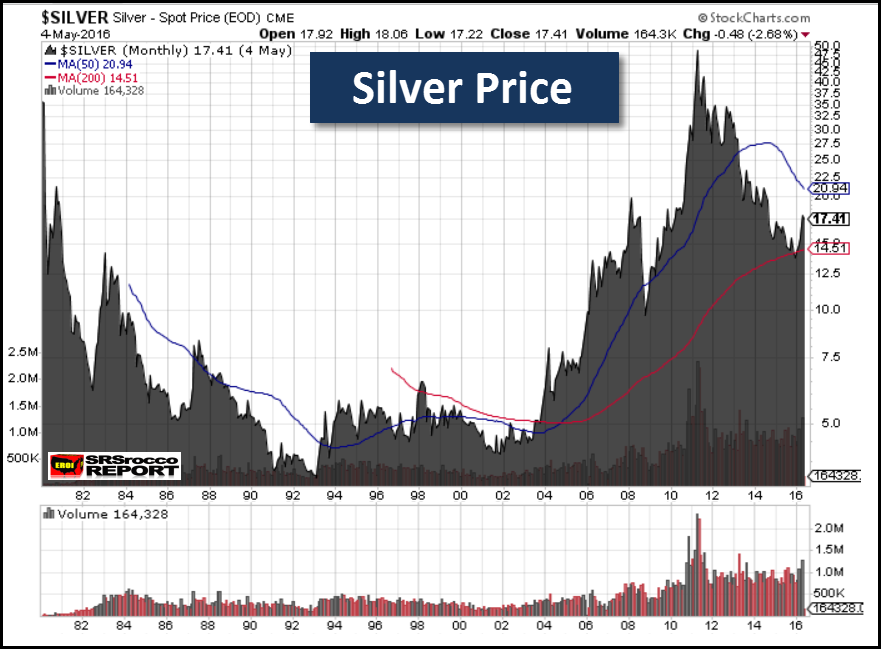
Not only has the current silver price fallen in half from its high in 1980, its trading volume continues to trend higher. What has happened here is this, the U.S. Government and Wall Street funneled American’s funds into financial instruments such as Stocks, Bonds and Retirement Accounts over the past 3-4 decades. These supposed financial products are nothing more than debts masquerading as assets.
Let me present the next chart on the increase in U.S. Retirement Assets:
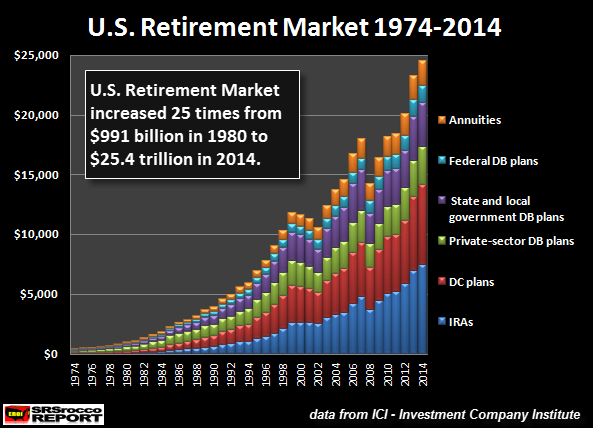
When the price of silver traded at $35 in 1980, total U.S. Retirement assets equaled $991 billion. By the end of 2014, the total U.S. Retirement market increased 25 times to $24.5 trillion. Thus, during the time period when total U.S. debt increased 22 times, the Dow Jones Index jumped 21 times and the U.S Retirement Market ballooned 25 times.
Unfortunately, the majority of Americans are holding onto financial assets that are backed by U.S. debt that is 22 times higher than it was in 1980. There lies the RUB.
So, why will the price of silver jump as financial instruments implode? Because investors will move into physical silver in a big way as is not backed by debt. This is the same as saying, “silver doesn’t have any counter-party risk.” The counter-party risk in most financial assets is the massive debt. Here is a chart comparing a (1 oz) silver coin versus the U.S. Retirement Market:
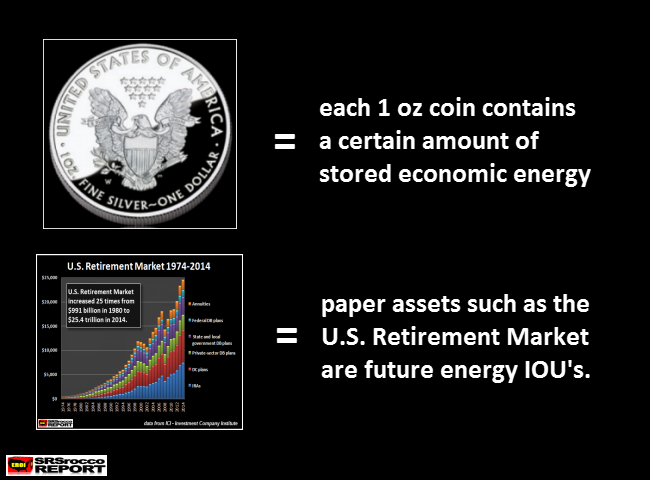
The economic energy value of a physical one ounce silver coin is stored in it, whereas the value of the U.S. Retirement Market is based on a massive amount of ENERGY DEBT. Unfortunately, we will not have the cheap and available energy supply in the future to pay back this ENERGY DEBT.
Thus, the collapse of financial assets will occur as the value of gold and silver rise to unimaginable levels. Why? Because gold and silver will be the only few liquid stores of economic energy in the entire market.
I conclusion, I don’t know what the Dow Jones-Silver ratio will fall to. However, I can tell you it will likely fall lower than the 25/1 ratio set in 1980.
Credit to srsroccoreport.com
https://srsroccoreport.com/the-historic-dow-jones-silver-ratio-points-to-300-silver/
TARGET LOSES BILLIONS AFTER CHANGING BATHROOM POLICY TO ALLOW TRANSGENDER

TARGET STOCK PRICES DROPPED 5.8 PERCENT 10 DAYS AFTER THE CORPORATION ANNOUNCED THEIR NEW STORE POLICY, ALLOWING CUSTOMERS TO CHOOSE THE BATHROOMS THEY USE BASED ON THE GENDER THEY IDENTIFY WITH, REGARDLESS OF WHETHER IT MATCHES THEIR BIOLOGICAL SEX.
“Submit yourselves therefore to God. Resist the devil, and he will flee from you.” James 4:7 (KJV)
EDITOR’S NOTE: If the over 1.1 million people who signed the pledge to boycott Target will adhere to that pledge, perhaps they and other retail outlets will get the message. Christians are called to be ‘salt and light’ to a lost and dying world. Fight the good fight, resist the Devil, and stand for something. You were not saved to be silent.
The drop in stock prices amounts to an estimated loss of $2.5 billion dollars, according the Family Policy Institute.
“On Friday, the shares of Target Corporation Common Stock (TGT) fell 2.52 percent in one day, according to recent reports. In addition since April 19th, the day they announced the new policy, the stock went from a share value of $84.14 to $79.27 per share,” reported The Daily Caller.
TARGET STOCK DROPPING, MAJOR CORPORATIONS JUMP ON TRANSGENDER BANDWAGON
Credit to http://www.nowtheendbegins.com/target-loses-billions-after-changing-bathroom-policy-to-allow-transgender-men-in-ladies-room/
Rail Traffic Depression: 292 Union Pacific Engines Are Sitting In The Arizona Desert Doing Nothing

We continue to get more evidence that the U.S. economy has entered a major downturn. Just last week, I wrote about how U.S. GDP growth numbers have been declining for three quarters in a row, and previously I wrote about how corporate defaults have surged to their highest level since the last financial crisis. Well, now we are getting some very depressing numbers from the rail industry. As you will see below, U.S. rail traffic was down more than 11 percent from a year ago in April. That is an absolutely catastrophic number, and the U.S. rail industry is feeling an enormous amount of pain right now. This also tells us that “the real economy” is really slowing down, because less stuff is being shipped by rail all over the nation.
One of the economic commentators that I have really come to respect is Wolf Richter of WolfStreet.com. He has a really sharp eye for what is really going on in the economy and in the financial world, and I find myself quoting him more and more as time goes by. If you have not checked out his site yet, I very much encourage you to do so.
On Wednesday, he posted a very alarming article about what is happening to our rail industry. The kinds of numbers that we have been seeing recently are the kinds of numbers that we would expect if an economic depression was starting. The following is an excerpt from that article…
Total US rail traffic in April plunged 11.8% from a year ago, the Association of American Railroads reported today. Carloads of bulk commodities such as coal, oil, grains, and chemicals plummeted 16.1% to 944,339 units.The coal industry is in a horrible condition and cannot compete with US natural gas at current prices. Coal-fired power plants are being retired. Demand for steam coal is plunging. Major US coal miners – even the largest one – are now bankrupt. So in April, carloads of coal plummeted 40% from the already beaten-down levels a year ago.
Because rail traffic is down so dramatically, many operators have large numbers of engines that are just sitting around collecting dust. In his article, Wolf Richter shared photographs from Google Earth that show some of the 292 Union Pacific engines that are sitting in the middle of the Arizona desert doing absolutely nothing. The following is one of those photographs…
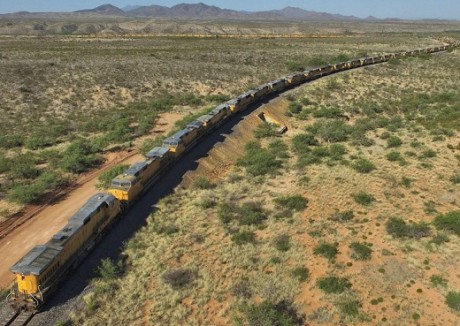
As Wolf Richter pointed out, it costs a lot of money for these engines to just sit there doing nothing…
These engines are expensive pieces of equipment. When they just sit there, not pulling trains, they become “overcapacity,” and they get very expensive. Then there are engineers and other personnel who suddenly become unproductive. Some of them have already been laid off or are getting laid off.
All over the world, similar numbers are coming in. For example, the Baltic Dry Index fell 30 more points on Wednesday after falling 21 on Tuesday. Global trade is really, really slowing down during the early portion of 2016. What this means on a practical level is that a lot less stuff is being bought, sold and shipped around the planet.
It is becoming increasingly difficult for authorities to deny that a new global recession has begun, and at this moment we are only in the very early chapters of this new crisis.
Another thing that I watch very closely is the velocity of money. When an economy is healthy, people feel pretty good about things and money tends to circulate fairly rapidly. For example, I may buy something from you, then you may buy something from someone else, etc.
But when times get tough, people tend to hold on to their money more tightly, and that is why the velocity of money goes down when recessions hit. In the chart below, the shaded areas represent recessions, and you can see that the velocity of money has declined during every single recession in the post-World War II era…
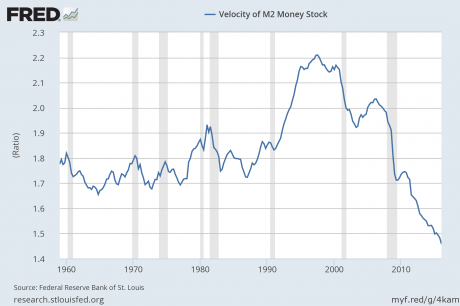
During the last recession, the velocity of money declined precipitously, and that makes perfect sense. But then a funny thing happened. There was a slight bump up once the recession was over, but then it turned down again and it has kept going down ever since.
In fact, the velocity of money has now dropped to an all-time low. The velocity of M2 just recently dipped below 1.5 for the first time ever.
This is not a sign of an “economic recovery”. What this tells us is that our economy is very, very sick.
And we can see evidence of this sickness all around us. For instance, the Los Angeles Times is reporting that homelessness in Los Angeles increased by 11 percent last year, and this marked the fourth year in a row that homelessness in the city has increased…
Homelessness rose 11% in the city of Los Angeles and 5.7% in the county last year despite an intensive federal push that slashed the county ranks of homeless veterans by nearly a third, according to a report released Wednesday.The increase marks the fourth consecutive year of rising homelessness in L.A., as local officials struggle to identify funding for billion-dollar plans they approved to solve the nation’s most intractable homeless problem.
Let us also not forget that about half the country is basically flat broke at this point.
Just recently, the Federal Reserve found that 47 percent of all Americans could not pay an unexpected $400 emergency room bill without selling something or borrowing the money from somewhere.
With numbers such as these being reported, how in the world can anyone possibly claim that the U.S. economy is in good shape?
It boggles the mind, and yet there are people out there that would actually have you believe that everything is just fine.
The current occupant of the White House is one of them.
With each passing month, the real economy is getting even worse. We may not have slipped into a full-blown economic depression just yet, but it is coming.
For now, let us be thankful for whatever remains of our debt-fueled prosperity, because we don’t deserve the massively inflated standard of living that we have been enjoying.
We have been consuming far more than we produce for decades, but it won’t last for much longer. And when those days are gone for good, we will mourn them bitterly.
Credit to Economic Collapse
Iranian commander threatens to close Strait of Hormuz to US
Iran — The deputy commander of Iran’s powerful Revolutionary Guard said Iranian forces will close the strategic Strait of Hormuz to the United States and its allies if they “threaten” the Islamic Republic, Iranian state media reported on Wednesday.
The comments by Gen. Hossein Salami, carried on state television, follow a long history of both rhetoric and confrontation between Iran and the US over the narrow strait, through which nearly a third of all oil traded by sea passes.
The remarks by the acting commander of the Guard also follow those of Supreme Leader Ayatollah Ali Khamenei who on Monday criticized US activities in the Persian Gulf. It’s unclear whether that signals any new Iranian concern over the strait or possible confrontation with the US following its nuclear deal with world powers.
The US Navy’s 5th Fleet, based in Bahrain, did not immediately respond to a request for comment.

IRGC Deputy Commander Hossein Salami (YouTube screen capture)
In his remarks, Salami said that “Americans should learn from recent historical truths,” likely referring to the January capture of 10 US sailors who entered Iranian waters. The sailors were released less than a day later, though state TV aired footage of the sailors on their knees with their hands on their heads.
“If the Americans and their regional allies want to pass through the Strait of Hormuz and threaten us, we will not allow any entry,” Salami said, without elaborating on what he and other leaders would consider a threat.
He added: “Americans cannot make safe any part of the world.”
The US and Iran have a long history of confrontations in the Persian Gulf. They even fought a one-day naval battle on April 18, 1988, after the near-sinking of the missile frigate USS Samuel B. Roberts by an Iranian mine. That day, US forces attacked two Iranian oil rigs and sank or damaged six Iranian vessels.

US Navy 5th Fleet (photo credit: Seaman Chad R. Erdmann/US Navy)
A few months later, in July 1988, the USS Vincennes in the strait mistook an Iran Air flight heading to Dubai for an attacking fighter jet, shooting down the plane and killing all 290 people aboard.
US Navy officials say they face near-daily encounters with Iranian naval vessels. In January, an unarmed Iranian drone flew over a US aircraft carrier in the Persian Gulf, the first since 2014, according to Navy records obtained by The Associated Press.
The US has also criticized what it called a “highly provocative” Iranian rocket test in December near its warships and commercial traffic. Iran said it has the right to conduct tests in the strait and elsewhere in Gulf.
Iran also sank a replica of a US aircraft carrier near the strait in February 2015 and has said it is testing “suicide drones” that could attack ships
Credit to timesofisrael.com
http://www.timesofisrael.com/iranian-commander-threatens-to-close-strait-of-hormuz-to-us/
The comments by Gen. Hossein Salami, carried on state television, follow a long history of both rhetoric and confrontation between Iran and the US over the narrow strait, through which nearly a third of all oil traded by sea passes.
The remarks by the acting commander of the Guard also follow those of Supreme Leader Ayatollah Ali Khamenei who on Monday criticized US activities in the Persian Gulf. It’s unclear whether that signals any new Iranian concern over the strait or possible confrontation with the US following its nuclear deal with world powers.
The US Navy’s 5th Fleet, based in Bahrain, did not immediately respond to a request for comment.
IRGC Deputy Commander Hossein Salami (YouTube screen capture)
In his remarks, Salami said that “Americans should learn from recent historical truths,” likely referring to the January capture of 10 US sailors who entered Iranian waters. The sailors were released less than a day later, though state TV aired footage of the sailors on their knees with their hands on their heads.
“If the Americans and their regional allies want to pass through the Strait of Hormuz and threaten us, we will not allow any entry,” Salami said, without elaborating on what he and other leaders would consider a threat.
He added: “Americans cannot make safe any part of the world.”
The US and Iran have a long history of confrontations in the Persian Gulf. They even fought a one-day naval battle on April 18, 1988, after the near-sinking of the missile frigate USS Samuel B. Roberts by an Iranian mine. That day, US forces attacked two Iranian oil rigs and sank or damaged six Iranian vessels.
US Navy 5th Fleet (photo credit: Seaman Chad R. Erdmann/US Navy)
A few months later, in July 1988, the USS Vincennes in the strait mistook an Iran Air flight heading to Dubai for an attacking fighter jet, shooting down the plane and killing all 290 people aboard.
US Navy officials say they face near-daily encounters with Iranian naval vessels. In January, an unarmed Iranian drone flew over a US aircraft carrier in the Persian Gulf, the first since 2014, according to Navy records obtained by The Associated Press.
The US has also criticized what it called a “highly provocative” Iranian rocket test in December near its warships and commercial traffic. Iran said it has the right to conduct tests in the strait and elsewhere in Gulf.
Iran also sank a replica of a US aircraft carrier near the strait in February 2015 and has said it is testing “suicide drones” that could attack ships
Credit to timesofisrael.com
http://www.timesofisrael.com/iranian-commander-threatens-to-close-strait-of-hormuz-to-us/
Russian Pacific Fleet ships to join ADMM-PLUS-2016 international naval exercise


A detachment of ships of the Russian Pacific Fleet including the big antisubmarine ship Admiral Vinogradov, the oceanic rescue ship Fotiy Krylov and the tanker Irkut that is now making a long distance voyage has called in the port of Muara in Brunei and is preparing to join the international naval exercise ADMM-PLUS-2016 in the South China Sea, the chief of the press service of Russia's Eastern Military District told TASS on Wednesday.
"The ships will leave the port to drill episodes of the war games as part of a multinational force," he said. "They will take part in communication maneuvers, simulate patrolling of a designated water area and take part in joint antiterrorist actions with counterpart naval forces from other countries ."
"In line with the plan of the exercise, the crews of the ships will also join a helicopter exercise and an operation to cut short the contraband of weapons," Martov said, adding that the exercise would be held in the territorial waters of Brunei-Darussalam.
The ships will call out of the port on May 5.
On Monday, the Pacific Fleet's delegation took part in the opening ceremony of the naval war games that brought together the ships of ten countries. It also received a Russian diplomatic mission led by the Russian ambassador to Brunei, Vladislav Semivolos, aboard the Admiral Vinogradov and held a protocol meeting with the commander-in-chief of Brunei's Naval Force.
Martov indicated that after Brunei the ships would call into the port of Singapore, also as part of ADMM-PLUS-2016, on May 8.
More:
http://tass.ru/en/defense/873724
Subscribe to:
Posts (Atom)