
Analyzing the US Mint Sales Numbers
When analyzing sales numbers it is important that investors go past the headlines and dig deep into the true nature of the sales. For brevity we are only showing the last few years of sales, but for doing comparisons we have used data from the beginning of the current bull market in 2001. We also use the average monthly London price fix to calculate the dollar value of the month's bullion sales.
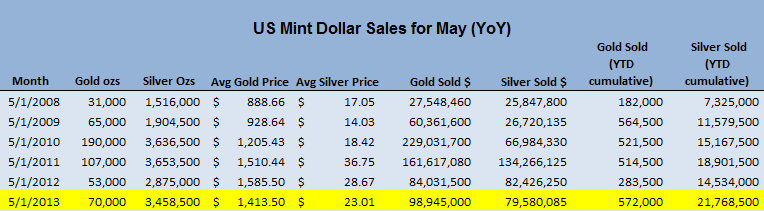
To start, let's take a look at the U.S. Mint sales numbers for silver and gold for May and compare them to the same month in previous years. We are doing a year-over-year comparison because coin sales are very seasonal in nature and to get a fair read we have to compare May to May.
(Click to enlarge)
We know that last month's April sales broke all sorts of sales records, so we were expecting a little bit of a slowdown in gold and silver sales. May sales came down from the previous month's totals, but still are at exceptionally high levels. Richard Peterson, the acting director of the U.S. Mint, commented that "Demand right now is unprecedented. We are buying all the coin (blanks) they can make," - that comment was made in June or two months AFTER the record-breaking April.
As investors can see from the table above, May sales continue to be exceptionally high for gold and silver. Silver once again surpassed 3 million ounces sold for the month and gold was fairly strong at 70,000 ounces sold. On a year-to-date basis, gold and silver sales are still breaking records and gold sales are 8,000 ounces higher than any other previous year, while silver sales are almost 2 million higher than the second highest silver sales year.
Canadian Mint Sales
Silver sales were also strong in Canada, as the Royal Canadian Mint (RCM) issued its first quarter report showing that it is also seeing record breaking sales. Unfortunately, the RCM does not issue monthly statistics, but on a quarterly basis (January through March of 2013) it has sold 269,000 gold ounces (96% higher than the 2012 first quarter) and 6.6 million silver ounces (65% higher than the 2012 first quarter). These sales numbers were before the major price drop in April, so we expect that second quarter sales numbers will be significantly higher than even this stellar first quarter.
US and Canadian Silver Mine Supply
Another interesting thing about these sales numbers is when investors compare them to the mining statistics from these two countries. According to the USGS in 2012, the U.S. mined around 34 million ounces of silver, while Canada mined around 17 million ounces of silver.
Let us now extrapolate U.S. and Canadian sales numbers to forecast how many ounces of silver will be sold by the end of the year. Since a linear calculation would be inaccurate (bullion sales are not linear in nature), we will simply compare our year-to-date sales totals with the next highest year and then forecast our number based on the comparison year's ending total.
Year-to-date U.S. sales are 21.7 million ounces of silver sold, which is around 15% higher than the second highest year-to-date sales for this period (in 2011). It would be fair to expect that if we run at the current pace we will end 15% higher than 2011 totals (39.8 million silver ounces sold in 2011) - which would put our 2013 forecast of silver sales at 46 million ounces.
For 2012, the Royal Canadian Mint sold 18.1 million silver maples and if we also extrapolate our first quarter numbers (65% higher than first quarter 2012) out for the rest of 2013 based on this total, they come out to a forecast of around 30 million ounces of silver. Again, this completely ignores the month of April - where we expect sales were record-breaking.
Based on year-to-date numbers, we forecast that the U.S. Mint will sell 46 million ounces of silver, while the RCM will sell 30 million ounces of silver - both significantly higher than their expected silver mine production amounts for 2013. In fact, if sales stay at these elevated levels, these two countries will be around 25 million ounces SHORT of silver - which means silver will have to be imported to satisfy mint demand.
Remember that we are exclusively talking about mint demand for silver to produce U.S. American Silver Eagles and Canadian Silver Maple coins - these demand totals assume absolutely no industrial or alternative investment (bars, rounds, etc) demand whatsoever. What happens if North American industry actually needs to use silver?
Finally, our mine production forecasts were based on 2012 USGS totals and as we know many primary silver miners are struggling to produce silver economically at current prices. In fact based on our exhaustive 2012 true all-in cost data, most silver miners are already below their all-in production costs for silver - which will lead to significant cost-cutting and cuts in exploration and silver supply. This probably will result in much lower silver production for 2013 as production is cut - so our 25 million ounce silver deficit for bullion production may be much higher if mines produce less silver than in 2012.
Conclusion
If investor physical demand stays at current levels, we think that the silver market can provide investors with a spectacular opportunity because the supply and demand picture is so bullish for silver. The fact that all U.S. and Canadian silver mine production will go to solely satisfy domestic demand for government issued coins (and supply will still be 25 million ounces short), should make investors turn their heads.
Industrial demand and alternative bullion suppliers will have no physical silver supply to use, and their silver needs will have to come from imports of silver. Additionally, low silver prices will cause many miners to cut production because their costs are above current silver spot prices, and so we also expect a drop in mine production. Finally, silver scrap supplies, which make up around 25% of silver supply, will definitely be impacted by low silver prices and we expect this source of supply to also drop. Throw in the exceptionally large short position that hedge funds and retail investors have taken in silver, and you have all the ingredients for an explosion in the silver price.
Investors should consider adding to positions in SLV, PSLV, SIVR, and CEF to get exposure to silver because we believe that the physical markets will be the source of a significant turnaround in the silver price. Also, investors should make sure they hedge their paper silver positions with physical silver bullion - this will not only hedge them from calamities in the financial markets, but it will also add to the physical pressure on the silver market and thus benefit their positions.
The supply and demand picture is about to get extremely tight in silver and we believe there will be a significant jump in the price as investors and shorts realize this - we think it is prudent to have an oversized position in both the silver ETFs and physical silver when the market realizes this.
Seeking Alpha
No comments:
Post a Comment