We might be on the verge of another huge market crash, one similar to 2008.
Check out the following chart below, and you will see why…
- The RSI hasn’t been overbought anymore in a long time, indicating weakness in stock markets… The same was true in 2008.
- The SP500 found heavy resistance in the 1260-1280 zone (just as we warned our subscribers), which was the low of June 2011. A similar thing happened back in May 2008, where price ran into resistance of the November 2007 low.
- Look at the exponential moving averages (20, 50, 100 and 200 EMA’s). They have now been converging as price rallied, but right now, price is falling below these EMA’s, just like in late May 2008.
- The MACD is now flirting to break the green support line, just like in May 2008, right before financial armageddon occured, and price is right at the green support line now, just like in 2008.
- The MACD is now flirting to break the green support line, just like in May 2008, right before financial armageddon occured, and price is right at the green support line now, just like in 2008.
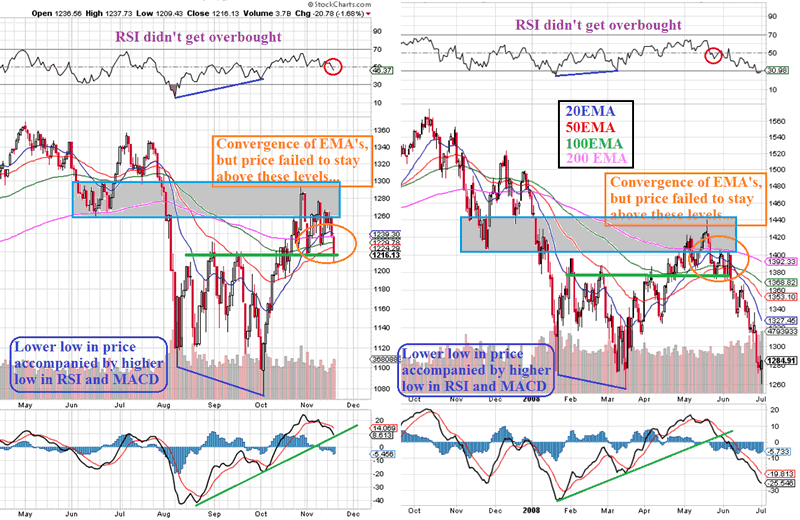
Chart courtesy stockcharts.com
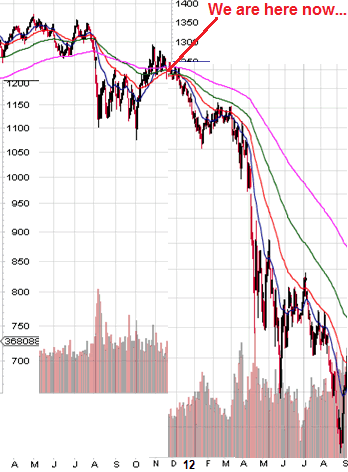
If we are about to see the exact move as in 2008, this is what it would look like…
If we are about to see the exact move as in 2008, this is what it would look like…
However, Charles Schwab and Sentimentrader noted: “On Friday 11th of November, the market experienced the 17th time in the past three months that the S&P 500 SPY (exchange-traded fund trading the S&P 500) gapped by more than 1% at the open and then didn’t close that gap during the day. This means that the S&P didn’t reverse enough to “kiss” the previous day’s close. As you can see in the chart below, this level of “unclosed gap” behavior has been seen only four other times since the early-1990s. All occurred while the market was forming a major bottom.”
No comments:
Post a Comment